Market Update October 2017 – Conejo Valley and Surrounding Area
(Released October 2, 2017)

MICHAEL’S THOUGHTS ABOUT THE LOCAL MARKET
Lack of inventory continued to be an issue for buyers and that trend shows no signs of changing.
- The fall listing surge hasn’t happened so far and may not this year.
- Only 219 new homes came on the market last month while 254 went into escrow.
- Leading to another big drop in inventory – down 20% to 715 homes vs. 895 last year.
- And the median price of a home continued up 3% to $773k in September.
(Read: Why Are There So Few Conejo Valley Homes For Sale)
What Should We Expect Going Forward
- Expect homes under $1 mil to continue to sell relatively quickly in high demand neighborhoods.
- But homes over $1 mil face more competition, fewer potential buyers, and take longer to sell.
- Buyers waiting for a surge of inventory may grow impatient.
- As homeowners are staying put and demand continues to rise.
WHAT’S THE 2017 CALIFORNIA FORECAST?
According to the California Association of REALTORS,
- The median price of a home is expected to increase 4.3% in 2017.
- The number of home sales is expected to increase by 1.3%.
- Interest rates are expected to climb to 4.0% on a 30 year fixed mortgage. (Read: Detailed Conejo Valley 2017 Forecast)
Market Snapshot
Home Prices
- The median price of a Conejo Valley home was up in September to $773,125.
- That’s 5 consecutive months up.
- Prices are up 3% from $747,500 last September.
- and $16,875 more than last month.
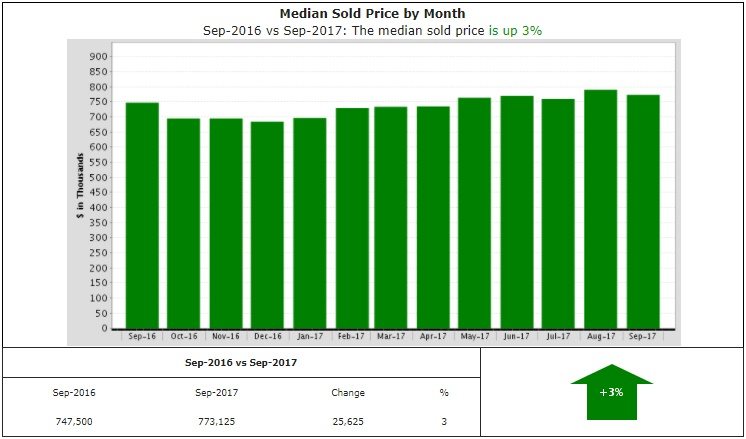
Home prices are up 3%
Homes For Sale
- September ended with 716 homes for sale.
- Down 20% from last September.
- That’s 180 fewer homes than last year.
- and 55 fewer homes than last month.
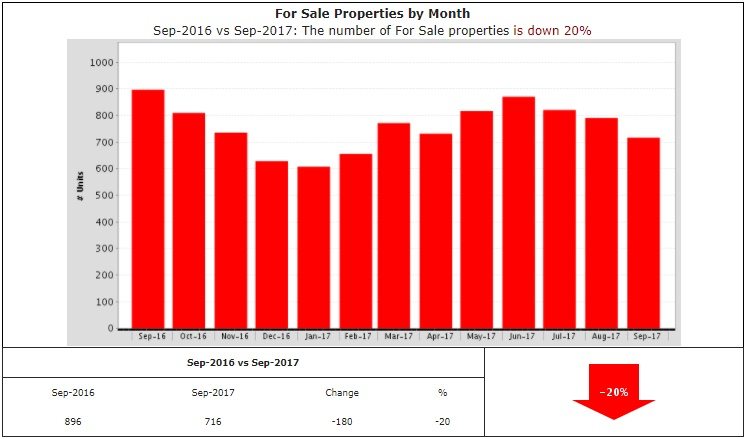
Homes for sale down 20%
Days to Sell a Home
- It took 58 days on average to sell a home in September.
- Down 14% from last September.
- 9 fewer days than last year.
- and 8 more days than last month.
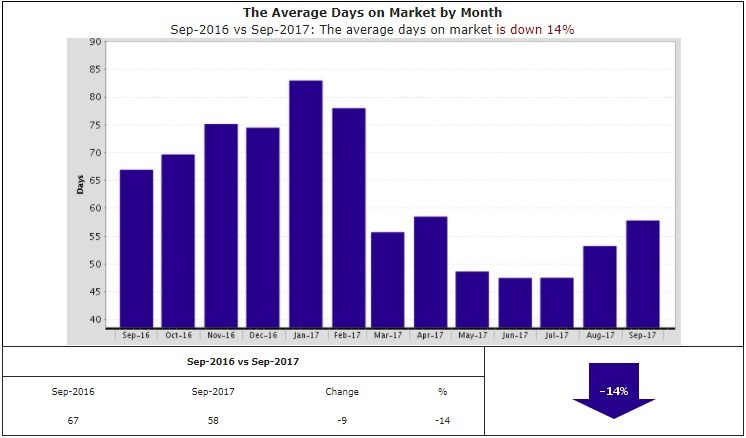
58 days on avg to sell a home
Interest Rates
| ||||||||||||||||||||||||||||||||||||||||||
If you are looking for a home, here’s a great place to start: Conejo Valley Neighborhood Video Tours.
Median Prices by City
(Prices below are for Aug 2017. City data is released a month late. Keep in mind that low volume of sales can cause large price fluctuations.)
Prices Released October 2, 2017
| City/County | # Sold | August 2017 | August 2016 | Y-T-Y % Chg |
|---|---|---|---|---|
| Ventura County | 977 | $565,000 | $533,750 | 5.9% |
| San Fernando Valley | 1379 | $585,000 | $540,000 | 8.3% |
| Agoura Hills | 27 | $777,000 | $720,000 | 7.9% |
| Calabasas | 51 | $1,476,000 | $1,395,000 | 5.8% |
| Camarillo | 114 | $567,500 | $544,250 | 4.3% |
| Moorpark | 51 | $620,000 | $554,500 | 11.8% |
| Newbury Park | 74 | $747,000 | $700,000 | 6.7% |
| Oak Park | 23 | $847,500 | $605,000 | 40.1% |
| Simi Valley | 178 | $563,000 | $520,000 | 8.3% |
| Thousand Oaks | 113 | $679,500 | $670,000 | 1.4% |
| Westlake Village (Ventura County) | 17 | $875,000 | $1,535,000 | -43.0% |
| Westlake Village (L.A. County) | 17 | $1,320,000 | $662,500 | 99.2% |
| Woodland Hills | 133 | $722,750 | $660,000 | 9.5% |