Market Update September 2017 – Conejo Valley and Surrounding Area
(Released September 2, 2017)

MICHAEL’S THOUGHTS ABOUT THE LOCAL MARKET
The seller’s market continued in August as buyers pounced on late summer listings thwarting historical trends.
- The usual August slowdown skipped this year.
- As 45% more homes went into escrow this August compared to last year.
- Median home prices jumped to $790,000, up 11%.
- And inventory of available homes continued to drop, down 20% from last August.
(Read: Why Are There So Few Conejo Valley Homes For Sale)
What Should We Expect Going Forward
- September is historically the beginning of the second busy season.
- But don’t hold your breath expecting a ton of new listings to hit the market.
- The same trend of low inventory and steady demand should continue.
- As buyers take advantage of historically low interest rates.
WHAT’S THE 2017 CALIFORNIA FORECAST?
According to the California Association of REALTORS,
- The median price of a home is expected to increase 4.3% in 2017.
- The number of home sales is expected to increase by 1.3%.
- Interest rates are expected to climb to 4.0% on a 30 year fixed mortgage. (Read: Detailed Conejo Valley 2017 Forecast)
Market Snapshot
Home Prices
- The median price of a Conejo Valley home was up in August to $790,000.
- That’s 4 consecutive months up.
- Prices are up 11% from $712,000 last August.
- and $28,000 more than last month.
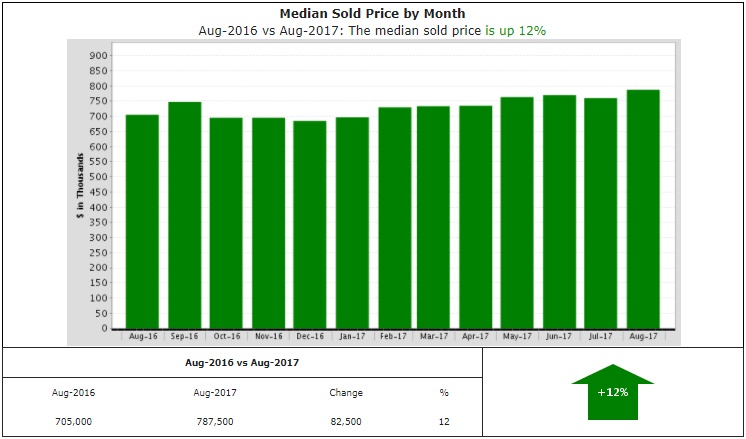
Home prices are up 11%
Homes For Sale
- August ended with 768 homes for sale.
- Down 20% from last August.
- That’s 192 fewer homes than last year.
- and 7 fewer homes than last month.
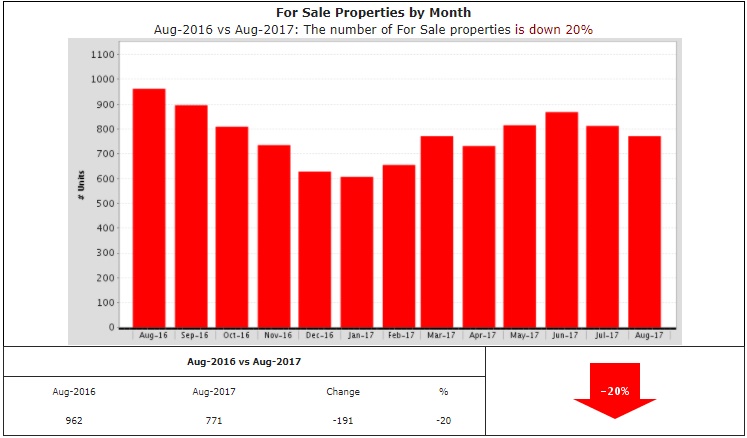
Homes for sale down 20%
Days to Sell a Home
- It took 50 days on average to sell a home in August.
- Down 19% from last August.
- 12 fewer days than last year.
- and 9 more days than last month.
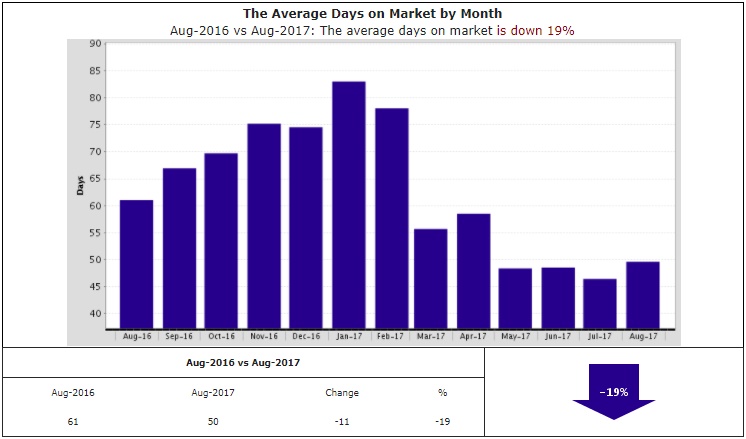
50 days on avg to sell a home
Interest Rates
| ||||||||||||||||||||||||||||||||||||||||||
If you are looking for a home, here’s a great place to start: Conejo Valley Neighborhood Video Tours.
Median Prices by City
(Prices below are for July 2017. City data is released a month late. Keep in mind that low volume of sales can cause large price fluctuations.)
Prices Released September 2, 2017
| City/County | # Sold | July 2017 | July 2016 | Y-T-Y % Chg |
|---|---|---|---|---|
| Ventura County | 903 | $559,000 | $523,000 | 6.9% |
| San Fernando Valley | 1050 | $590,000 | $545,000 | 8.3% |
| Agoura Hills | 40 | $818,250 | $840,000 | -2.6% |
| Calabasas | 35 | $1,397,000 | $1,005,000 | 39.0% |
| Camarillo | 120 | $541,000 | $550,000 | -1.6% |
| Moorpark | 43 | $685,000 | $665,000 | 3.0% |
| Newbury Park | 62 | $695,000 | $696,000 | -0.1% |
| Oak Park | 17 | $596,000 | $642,500 | -7.2% |
| Simi Valley | 165 | $533,750 | $504,000 | 5.9% |
| Thousand Oaks | 111 | $715,000 | $650,000 | 10.0% |
| Westlake Village (Ventura County) | 15 | $1,050,000 | $1,155,000 | -9.1% |
| Westlake Village (L.A. County) | 22 | $830,000 | $910,000 | -8.8% |
| Woodland Hills | 93 | $695,000 | $692,500 | 0.4% |